
Whether you’re buying, selling, investing, or simply following the Ottawa real estate market in 2026, understanding benchmark home prices is essential. Unlike average or median prices, which can fluctuate depending on the mix of homes sold in a given month, benchmark prices are designed to represent the value of a typical home using a consistent property profile.
This guide explains what benchmark prices are, how they’re calculated using the MLS® Home Price Index (HPI), and how buyers, sellers, and investors can use them to better interpret Ottawa housing market trends.
Table of Contents
- What is the MLS® Home Price Index (HPI)?
- Understanding the Benchmark Price in Ottawa
- How is the benchmark price calculated in Ottawa?
- MLS® HPI Benchmark Property Profiles
- Factors affecting benchmark changes:
- Benchmark Price vs. Market Reality
- Real-World Applications of Benchmark Prices
- February 2026 Ottawa Housing Market Snapshot
- FAQs: Common Questions About Benchmark Prices
What is the MLS® Home Price Index (HPI)?
The MLS® Home Price Index (HPI) is a statistical tool used across Canada to measure home price trends. Developed by the Canadian Real Estate Association (CREA), the HPI analyzes MLS® sales data and estimates the value of a typical home in different property categories.
By adjusting for features such as size, age, and location, the HPI provides a more accurate view of housing market trends than simple averages.
Because the MLS® Home Price Index measures trends across thousands of transactions and separates different housing categories, it provides a clearer picture of how property values are changing across the market. Buyers and sellers can see whether prices are rising, stabilizing, or softening over time rather than relying on isolated sales or monthly averages.
Understanding the Benchmark Price in Ottawa
What is a benchmark price in Ottawa real estate?
A benchmark price represents the estimated value of a typical home within a specific property type and market area. Instead of looking at the exact price of every property sold, the benchmark focuses on homes that match a standardized profile, allowing analysts to track price trends more accurately over time.
In Ottawa, benchmark prices are calculated using the MLS® Home Price Index (HPI) developed by the Canadian Real Estate Association (CREA). The HPI analyzes thousands of MLS® sales and adjusts for differences in features such as size, age, and location. This creates a model that estimates the value of a representative property known as the benchmark home.
Because the benchmark is based on consistent criteria, it provides a clearer picture of how home values are changing from month to month and year to year.
For example, if the benchmark price for a townhouse increases, it suggests that the value of a typical Ottawa townhome has risen, even if the specific homes sold that month vary in size, upgrades, or location.
This makes the benchmark price one of the most reliable tools for understanding real housing market trends.
Why benchmark prices matter more than averages
Benchmark prices help market participants make more informed decisions:
- Buyers can gauge whether a property is fairly priced.
- Sellers can set realistic asking prices.
- Investors can assess market trends and opportunities.
- Benchmark prices help track long-term home price trends, giving a clearer view of how the Ottawa market is evolving.
Average or median prices can be influenced by the types of homes sold in a given month.
For example:
- If mostly smaller condos sell the following month, the average price may appear to drop, even though the overall market is stable.
- If several luxury homes sell in one month, the average price may rise sharply, even if typical homes haven’t changed much in value.
Benchmark prices help remove this distortion by tracking the value of similar homes over time. This allows analysts, buyers, and sellers to see true market movement, rather than short-term fluctuations caused by the mix of properties sold.
Key differences from other metrics:
| Metric | Definition | Notes |
|---|---|---|
| Average price | Total sales ÷ number of homes | Can be skewed by unusually high or low sales |
| Median price | Middle sale price | Half of homes sell above, half below |
| Benchmark price | Typical property value | Standardized methodology for consistency |
Common misconceptions:
- Benchmark equals listing price → false
- All homes in a neighbourhood are equal → false
- Benchmark is static → false
For example, a townhouse in a popular neighbourhood may sell above the benchmark due to a finished basement or modern kitchen, while a similar property in a less popular neighbourhood may fall below.
How is the benchmark price calculated in Ottawa?
Benchmark prices in Ottawa are calculated using the MLS® Home Price Index (HPI) developed by the Canadian Real Estate Association (CREA). The HPI uses a statistical model that analyzes thousands of MLS® sales and adjusts for differences in property features such as size, age, location, and amenities.
The Ottawa Real Estate Board (OREB) then publishes the benchmark values each month as part of its market statistics reports.
This methodology helps isolate true market price movement by comparing similar property types over time rather than relying on raw sales averages.
Step-by-step process:
- Define a benchmark property profile for each housing type (single-family detached, townhouses, apartments).
- Analyze MLS® sales data across Ottawa.
- Adjust prices to account for differences in features such as size, age, and location.
- Estimate the value of a representative “benchmark home”.
- Publish updated benchmark prices monthly.
To make the benchmark consistent over time, the MLS® HPI defines a standardized property profile for each housing type. These profiles represent what a typical home in that category might look like in Ottawa.
MLS® HPI Benchmark Property Profiles
Composite:
The composite benchmark represents the overall housing market in Ottawa, combining trends across multiple property types rather than focusing on a single category such as detached homes, townhouses, or apartments. In other words, it reflects a standardized property profile designed to represent a typical home across the broader market. As a result, the composite benchmark is often used to track general price movement across the city and provide a high-level view of housing trends. By looking at the composite benchmark, buyers, sellers, and investors can gain insight into overall market performance, even before diving into specific property types or neighbourhoods. This makes it a useful tool for understanding citywide trends and spotting shifts that may affect individual markets.
The benchmark criteria for the composite home profile in Ottawa are:
- Above ground bedrooms: 3
- Age: 0–5 years
- Exterior walls: masonry & siding
- Gross living area: 1,366 sq. ft.
- Garage: attached, single width
- Heating: forced air, natural gas
- Foundation: poured concrete basement
- Total rooms: 7
Single Family Homes:
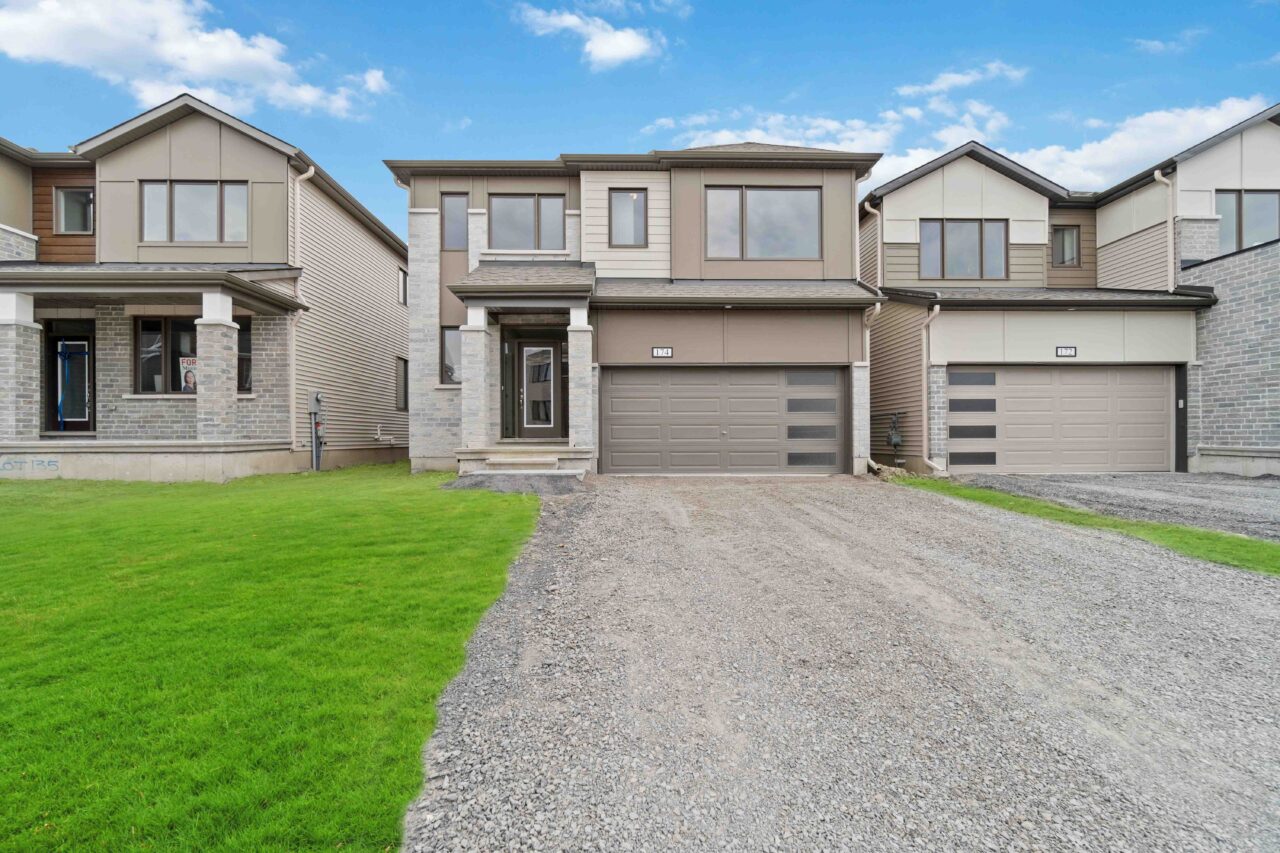
Single-family homes in Ottawa often have similar layouts with a single-width garage and a finished basement. Often referred to simply as a detached home, this property type is ideal for families and offers flexible living space. The benchmark criteria for a single family home in Ottawa are:
- Above ground bedrooms: 3
- Age: 0–5 years
- Basement: fully finished
- Gross living area: 1,566 sq. ft.
- Lot size: 5,993 sq. ft.
- Garage: attached, single width
- Heating: forced air, natural gas
- Fireplaces: 1
- Total rooms: 8
Townhouses:
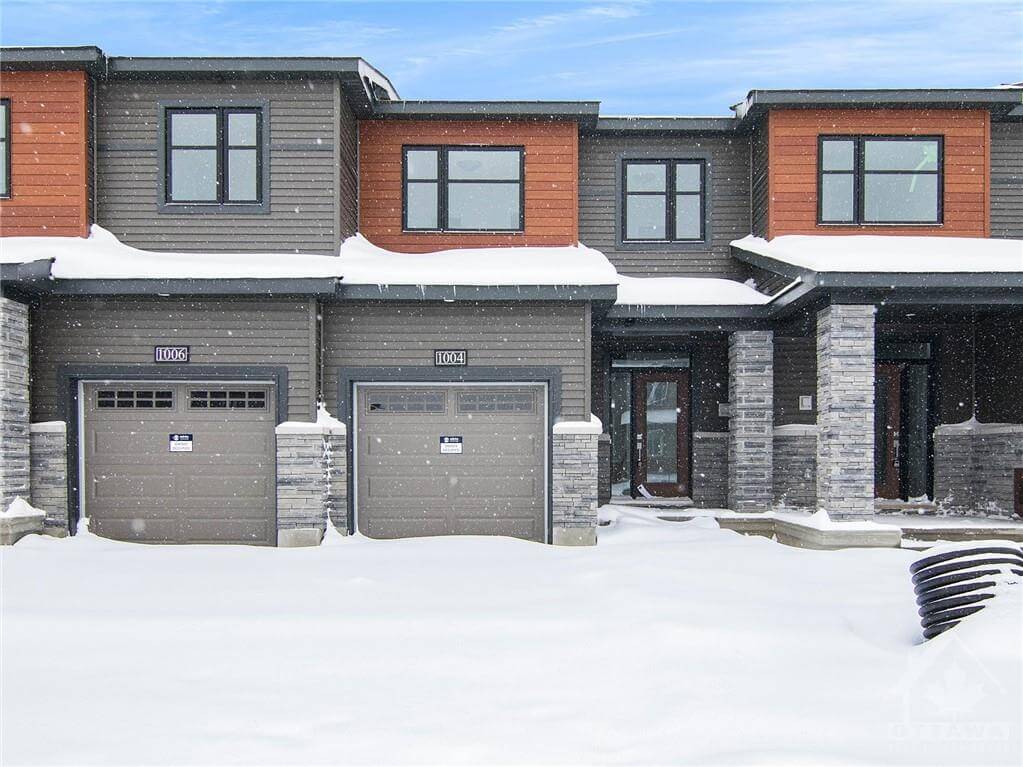
Also known as row units, townhomes in Ottawa feature shared walls with neighbours and are often popular among first-time buyers or those seeking lower maintenance. The benchmark criteria for a townhouse are:
- Above ground bedrooms: 3
- Age: 0–5 years
- Attached row specification
- Basement: fully finished
- Gross living area: 1,301 sq. ft.
- Garage: attached, single width
- Heating: forced air, natural gas
- Total rooms: 7
Apartments:
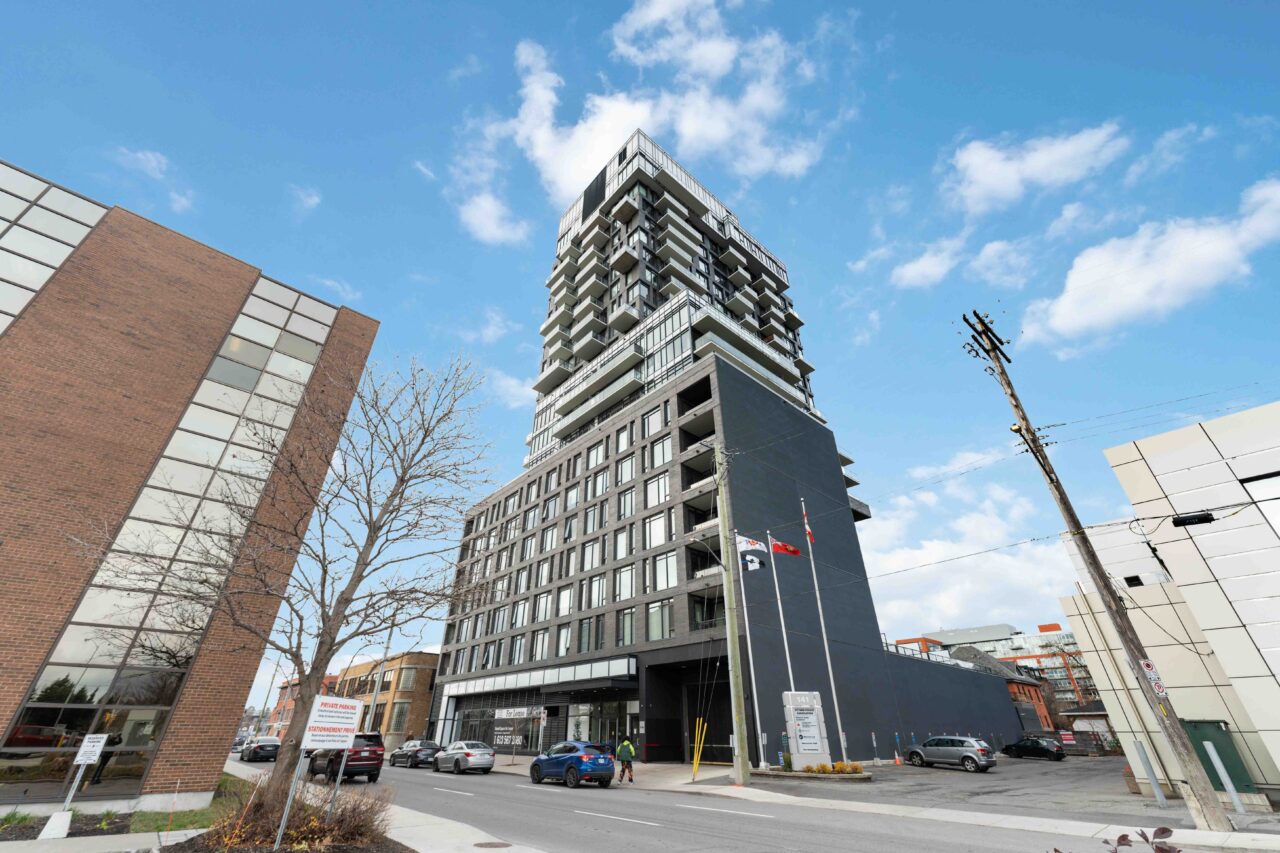
Sometimes referred to as flats, these units are typically smaller and more affordable, appealing to singles, couples, and investors. The benchmark criteria for an apartment in Ottawa are:
- Above ground bedrooms: 2
- Age: 6–15 years
- Gross living area: 952 sq. ft.
- Heating: forced air, natural gas
- Total rooms: 5
Understanding these profiles helps buyers and sellers interpret the benchmark correctly. For instance, a condo with more than 2 bedrooms or a finished basement may sell above the benchmark, while a smaller apartment might fall below.
Factors affecting benchmark changes:
- Interest rate changes and borrowing costs
- Supply and demand in the Ottawa housing market
- Population growth and migration into the city
- Neighbourhood popularity and amenities
- Property features, condition, and upgrades
Professional insight: Benchmark prices are most useful when combined with market expertise, neighbourhood knowledge, and property-specific details.
Benchmark Price vs. Market Reality
While benchmark prices reflect the value of a typical property, individual homes may sell above or below this level depending on upgrades, condition, and location.
How does benchmark price compare to actual sales?
- A renovated 3-bedroom detached home in Orleans may sell $50,000 above the benchmark.
- A condo in Vanier with outdated finishes may sell $15,000 below the benchmark.
Tips for interpretation:
- Buyers: Look at upgrades, condition, and month-over-month trends.
- Sellers: Price competitively relative to benchmark and recent sales.
- Neighbourhoods differ: Central condos may have softer benchmarks, detached homes in Barrhaven remain strong.
Real-World Applications of Benchmark Prices
How can buyers, sellers, and investors use benchmark prices?
Buyers:
- Compare the property to the benchmark for its type and location.
- Adjust your offer based on upgrades or condition.
- Use month-over-month changes to assess market trends.
Sellers:
- Price at or slightly below benchmark to attract offers.
- Factor in upgrades or unique features.
- Monitor local inventory to time your sale strategically.
Investors:
- Identify neighbourhoods with rising benchmarks for potential growth.
- Avoid overpaying in markets with soft benchmarks.
- Use benchmarks to guide rental pricing decisions.
To see how these benchmarks translate into current market conditions, let’s look at the latest Ottawa housing market data.
February 2026 Ottawa Housing Market Snapshot
What are the current benchmark and average prices in Ottawa?
![Ottawa real estate market statistics for [February 2026] showing HPI benchmark prices for single-family homes, townhouses, and apartments, plus residential average sale price, homes sold, new listings, active listings, and median days on market.](https://shaunnamcintosh.ca/wp-content/uploads/2026/03/26-02-residential-stats-1280x698.png)
Key statistics (all property types):
- Sales: 780 properties
- Average price: $662,773
- Inventory: 2,928 homes (3.8 months supply)
Property-type benchmarks:
- Single-family detached homes: $693,200 (-1.3% YoY)
- Townhomes & row units: $560,700 (-3.4% YoY)
- Apartments & flat: $385,500 (-2.7% YoY)
Trends & interpretation:
- Rising inventory overall; prices stable
- Strong townhome demand
- Softer apartment market → potential buyer leverage
Understanding benchmark prices helps bring clarity to the often confusing world of real estate statistics. While no single number can capture the full value of a property, benchmark prices provide one of the most reliable ways to track true housing market trends in Ottawa over time.
When combined with local expertise and professional guidance, benchmark data helps buyers and sellers approach real estate decisions with greater confidence.
Contact
FAQs: Common Questions About Benchmark Prices
Is the benchmark price the same as market value?
No. The benchmark price represents the estimated value of a typical property based on standardized features defined by the MLS® Home Price Index. The actual market value of a specific home may be higher or lower depending on factors such as renovations, condition, location within the neighbourhood, lot size, and buyer demand. Benchmark prices help show overall trends, while individual home values are determined by comparable sales and market conditions.
Why is the benchmark price important for buyers and sellers?
Benchmark prices help buyers and sellers understand the general value of a typical home in a specific property category. Buyers can use the benchmark to evaluate whether a property is priced fairly compared to the broader market, while sellers can use it as a reference point when setting a competitive listing price. When combined with comparable sales and neighbourhood insights, benchmark prices provide valuable context for real estate decisions.
What is the difference between benchmark price and average home price?
The average home price is calculated by adding up the total value of all homes sold during a specific period and dividing it by the number of sales. This number can fluctuate significantly depending on the mix of properties sold, such as luxury homes or smaller condos. The benchmark price, however, represents the estimated value of a typical home using a standardized property profile, making it a more consistent way to track market trends over time.
How often are benchmark prices updated in Ottawa?
Benchmark prices in Ottawa are updated monthly as part of the local housing market statistics published by the Ottawa Real Estate Board. These updates reflect changes in the MLS® Home Price Index based on recent MLS® sales data. Tracking these monthly changes helps buyers, sellers, and analysts understand how home values are evolving throughout the year.
Do benchmark prices vary by neighbourhood?
Yes. While overall benchmark prices are reported for major property types across the Ottawa market, actual home values can vary significantly between neighbourhoods. Factors such as location, proximity to transit and amenities, school districts, and local demand can influence whether a home sells above or below the benchmark price for its property type.